Core Trend indicator
Which way is the trend, and where would a trailing stop sit? One smooth line answers both: it trails under price in an uptrend and over it in a downtrend, with a cloud reaching toward price.
Not sold separately: every Holdout indicator and both strategies come in one plan, $39 a month. See pricing or start with the free Session Levels Lite.
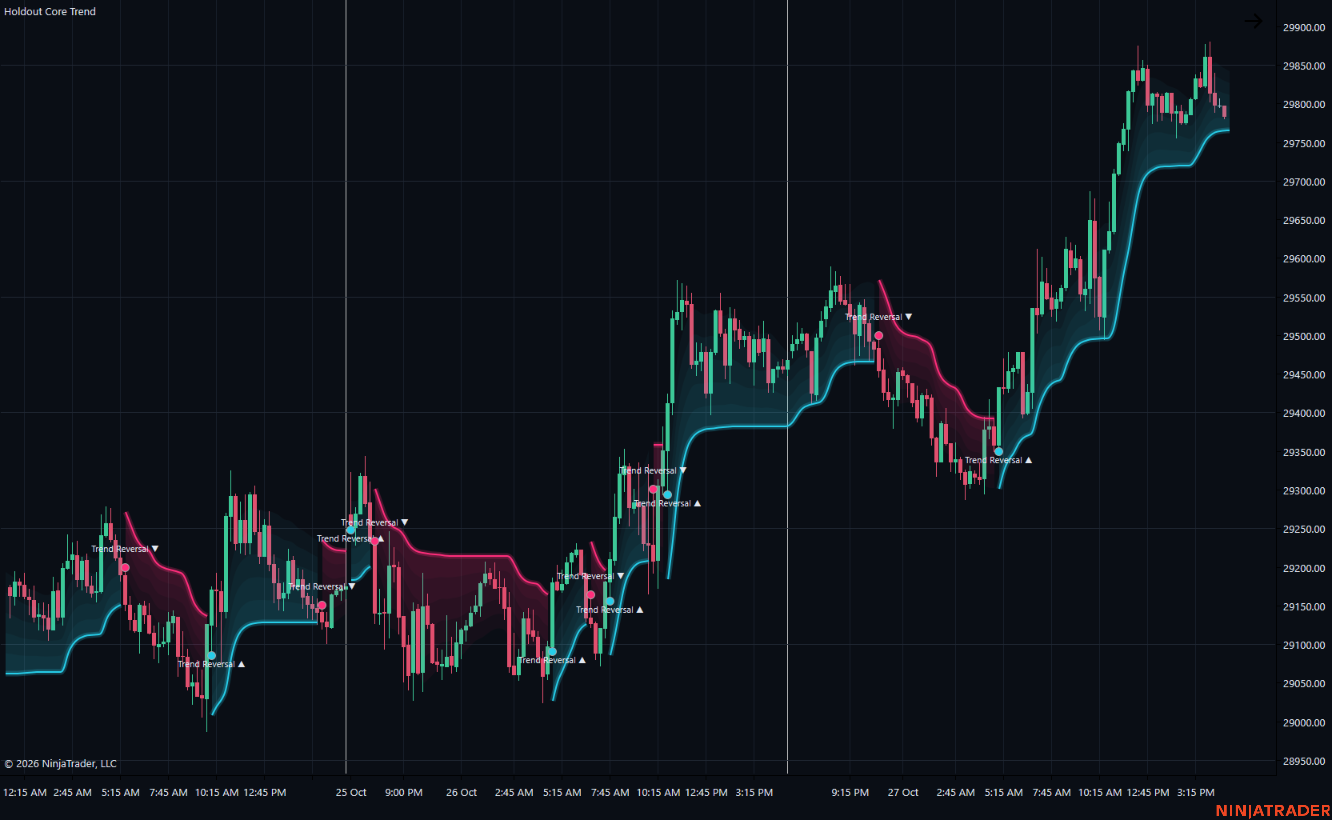
What it draws
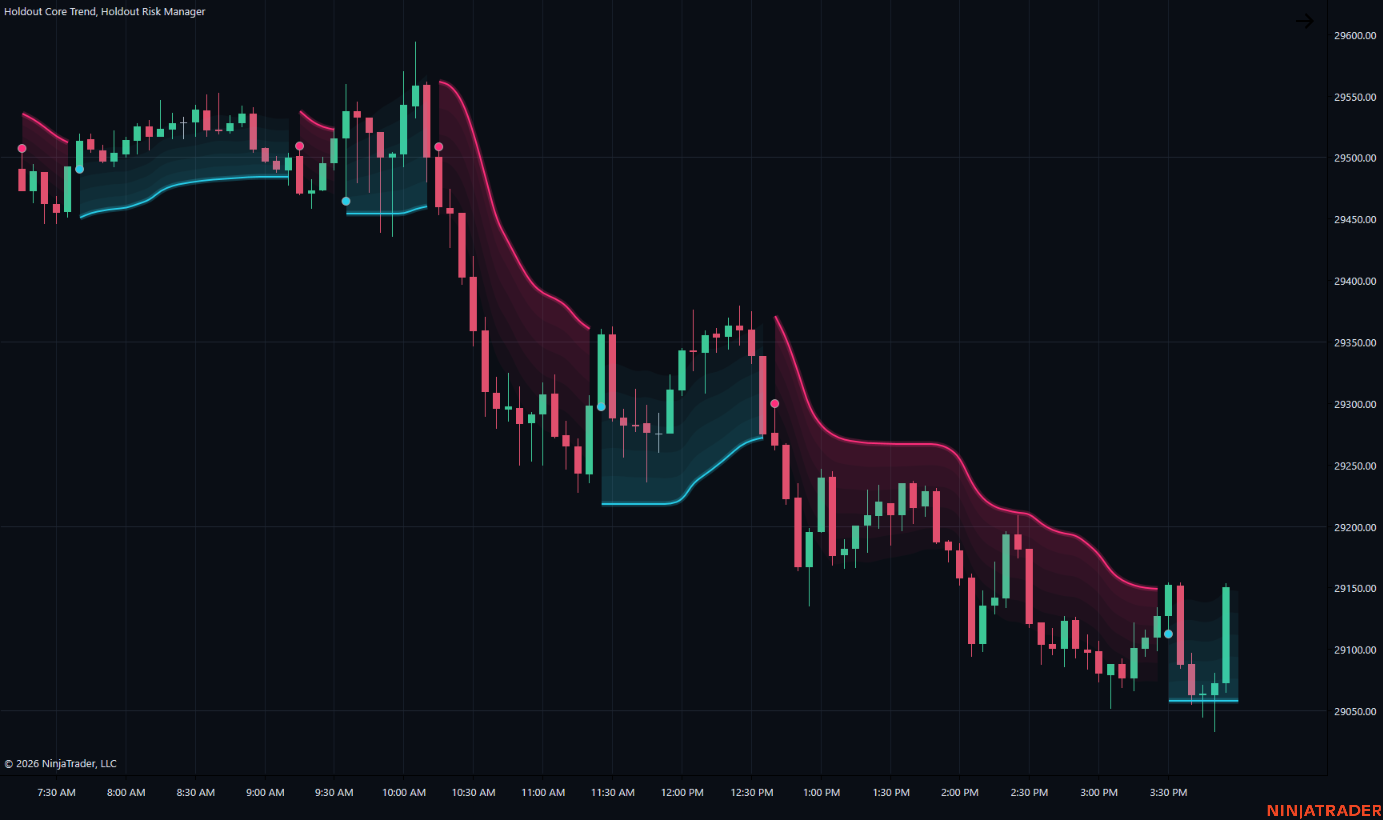
Trend line and volatility cloud
The line trails under price in an uptrend (teal) and over it in a downtrend (pink), smoothed so it curves instead of stepping. The cloud reaches from the line toward price and widens with volatility, so you can see how much room the trend is giving.
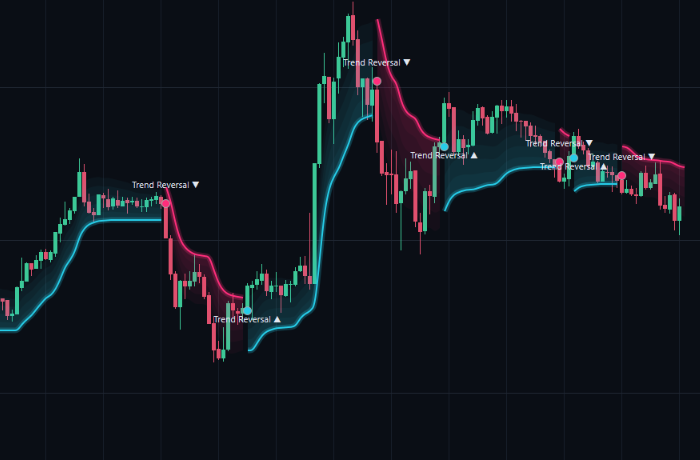
Flips, signals and reversal labels
A dot marks each flip. Optional ‘Trend Reversal ▲/▼’ labels and BUY/SELL signals call out the flips in words. In a range the line flips more often, which itself tells you the market isn't trending.
A trailing-stop reference
Because the line only moves with the trend, it doubles as a trailing stop: many traders hold while price stays on the trend side of it. Holdout Risk Manager uses the same engine to draw its stop and targets.
Three ready-made presets
Clean trend line, Trend cloud, and Trend + signals ship as indicator templates, so you can switch the look in two clicks.
Full feature list
- A smoothed ATR trailing line: teal under price in an uptrend, pink over price in a downtrend
- A volatility cloud from the line toward price, fading as it goes (width, opacity and fade adjustable)
- A dot where the trend flips
- Optional BUY / SELL signals and ‘Trend Reversal’ labels at each flip
- Flip sensitivity set by the ATR length and multiplier
- Optional alert on each flip, in NinjaTrader and on your phone
- Drawn as one smooth curve per trend, so it stays light even with months of history loaded
How it works
The line is an ATR trailing stop, the same family as the popular Supertrend: it only moves with the trend and flips when price closes through it by more than the ATR distance.
A short EMA smooths the line so it curves instead of stepping. The cloud's width is a multiple of ATR, so it widens when the market gets more volatile.
Holdout Risk Manager uses the same trend engine for its entry and stop, so the two read the same way on one chart.
Good to know
- Use it to read the trend and as a trailing-stop reference. In our tests a flip on its own wasn't a strong enough entry signal, so pair it with your levels or setups.
- A larger ATR multiplier means fewer, later flips; a smaller one reacts sooner but flips more often in a range.
Questions
Is this a Supertrend?
Which settings should I start with?
All 14 Holdout tools, one plan
Core Trend plus every other indicator and both strategies for $39 / month or $349 / year, or $599 once.