Higher-Timeframe Candles indicator
Keep the bigger picture on your execution chart: the 15-minute, 1-hour and 4-hour candles that are forming right now, drawn small at the right edge with their own volume levels.
Not sold separately: every Holdout indicator and both strategies come in one plan, $39 a month. See pricing or start with the free Session Levels Lite.
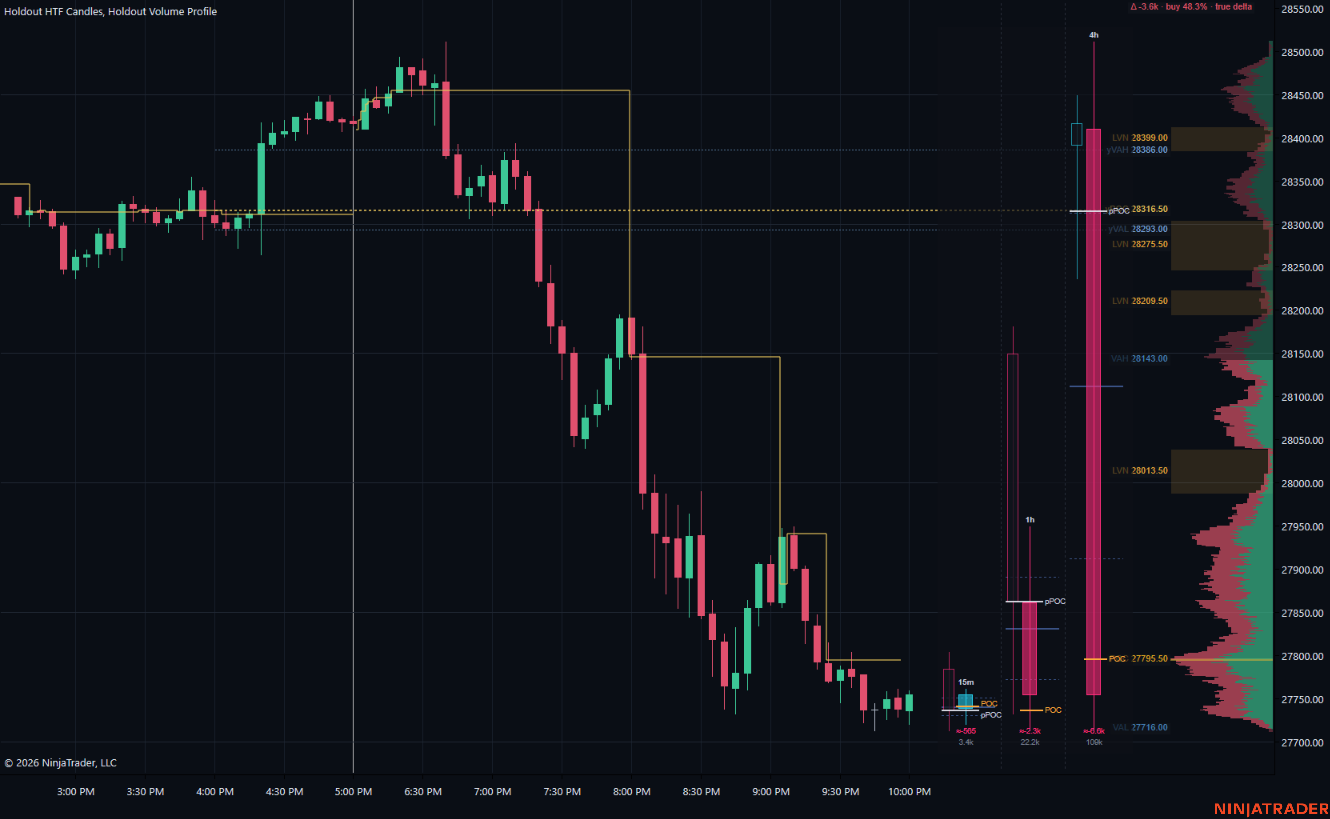
What it draws
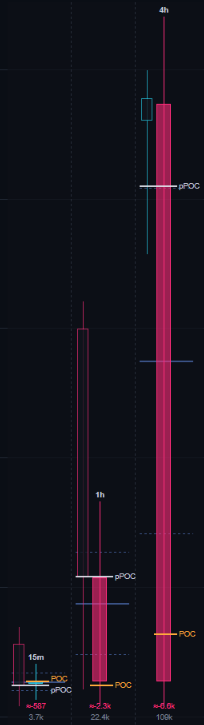
Higher-timeframe candles at the right edge
Up to four lanes, each from 5 minutes to daily, showing the forming candle with the previous one in outline. Your execution chart keeps the bigger picture.
Quartiles and POC of each candle
The 25%, 50% and 75% levels of each forming candle, its point of control and the previous candle's point of control, which can be extended across the chart.
Delta and volume per candle
Each forming candle shows its own delta and volume, so you can see which side is winning the 1-hour or 4-hour candle.
Weak pullback into the 4-hour POC
A marker for the one POC-retest pattern that held up out of sample in our NQ tests: price balances around the 4-hour POC, breaks away, pulls back with weak bars and a 15-minute bar rejects the POC. It draws the stop, a 1R target and the result.
Full feature list
- Up to four lanes, each 5-minute to daily, with the previous candle in outline
- 25%, 50% and 75% levels of each forming candle
- Each candle's point of control (POC) and the previous candle's POC, optionally extended across the chart
- Delta and volume of each forming candle
- Weak-pullback marker: price pulls back to the 4-hour POC after breaking away from it, and a 15-minute bar rejects it
- Sits beside Holdout Volume Profile automatically when both are on the chart
How it works
Candles are built from 1-minute bars and aligned to the 18:00 ET session open, so the 4-hour candles start at 18:00, 22:00, 02:00, 06:00, 10:00 and 14:00 ET.
Each candle's POC comes from a volume profile of that candle's own bars.
The marker needs price to have balanced around the 4-hour POC, broken at least half an average 15-minute range away, then pulled back with weak bars before a 15-minute bar rejects the POC. It draws the stop, a 1R target and the result.
Good to know
- The weak-pullback marker comes from the one POC-retest pattern that held up out of sample in our NQ tests. Use it as a high-quality spot to look for your own entry.
Questions
Which lanes should I use?
All 14 Holdout tools, one plan
Higher-Timeframe Candles plus every other indicator and both strategies for $39 / month or $349 / year, or $599 once.