Multi-Timeframe Panel indicator
Before you take a trade on a 1-minute chart, is the 1-hour trend with you? Is the market ranging? This panel answers in one glance, in a corner of any chart.
Not sold separately: every Holdout indicator and both strategies come in one plan, $39 a month. See pricing or start with the free Session Levels Lite.
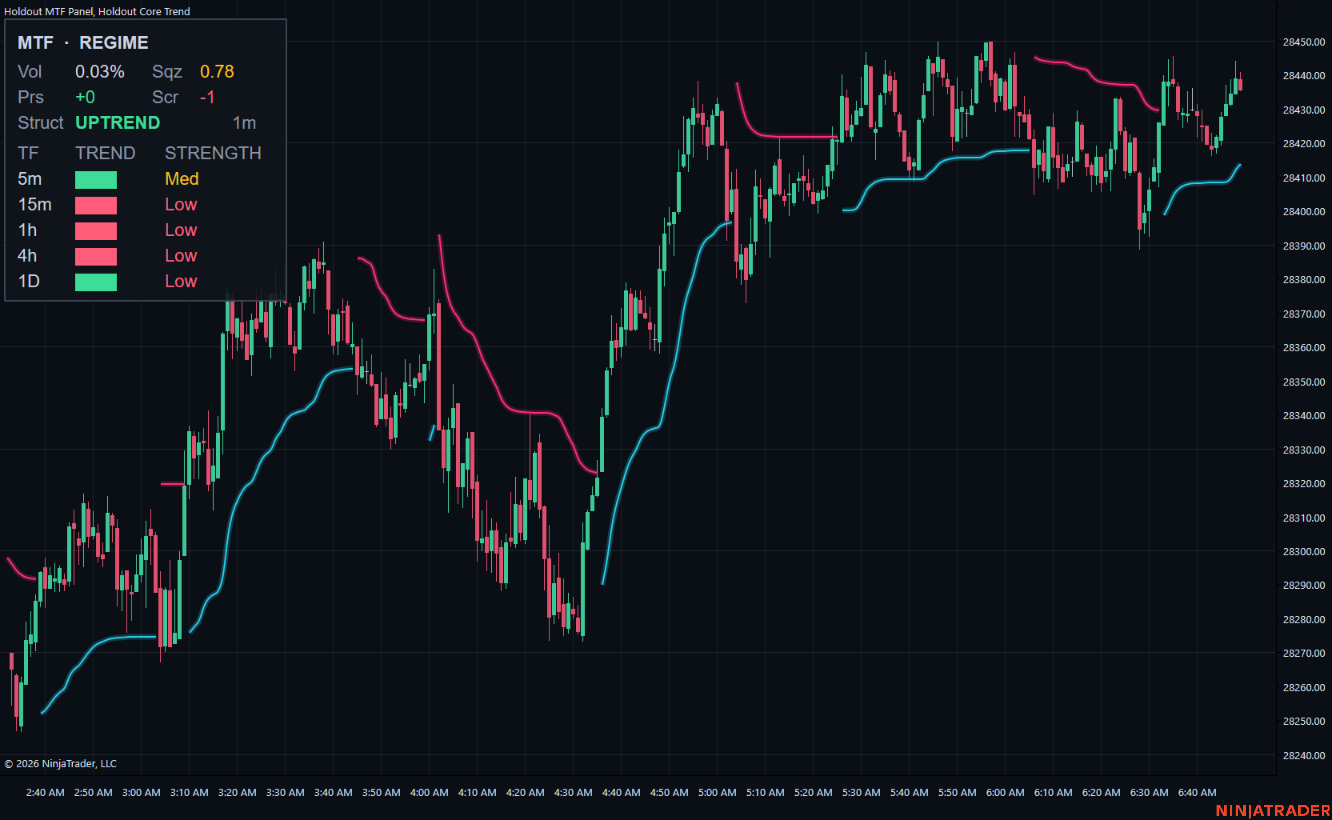
What it draws
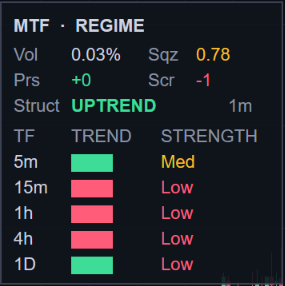
The whole picture in one panel
Rows for the 5-minute, 15-minute, 1-hour, 4-hour and daily trend, each with a strength reading, plus volatility, squeeze, pressure, the overall score and the chart's swing structure.
Trend and strength per timeframe
Green means the 20 EMA is above the 50 EMA on that timeframe, red below. Strength measures how far apart they are in that timeframe's average bar range: High is a clean trend, Med is building, Low reads as ranging.
Score and structure
Score adds up the five trend colours, from +5 (all up) to −5 (all down), so alignment is one number. Struct reads the last two swing highs and lows on your own chart: uptrend, downtrend, expansion (wider swings both ways) or compression (a squeeze).
Volatility, squeeze and pressure
Vol is the average true range as a percentage of price. Sqz compares the short-term range with the longer one and turns amber below 1, when the market is tightening. Prs counts up bars minus down bars over the last ten bars.
Any corner, any size
Put it in any corner and scale it from 50% to 250%; the text stays sharp, which helps on 4K screens.
Full feature list
- Trend on the 5-minute, 15-minute, 1-hour, 4-hour and daily charts: green up, red down
- Strength for each timeframe: High, Med or Low (Low reads as ranging)
- Score: how many of the five timeframes agree, from −5 to +5
- Struct: the swing structure on your chart: uptrend, downtrend, expansion or compression
- Vol: average true range as a percentage of price
- Sqz: a squeeze reading, amber when the market is tightening
- Prs: up bars minus down bars over the last ten bars
- Any corner, and a size setting for high-resolution screens
How it works
Each timeframe uses its own real bars, loaded by NinjaTrader, not bars rebuilt from your chart, so the 4-hour row matches a 4-hour chart.
Trend is the 20 EMA against the 50 EMA on that timeframe. Strength is how far apart the two are, measured in that timeframe's average bar range: at least 2 ranges is High, at least 1 is Med, less is Low.
Squeeze is the 10-bar ATR divided by the 50-bar ATR on your chart. Below 1, ranges are contracting.
Struct reads the last two swing highs and lows on your chart: higher highs and higher lows is an uptrend, lower highs and lower lows a downtrend, a higher high with a lower low is expansion, the opposite is compression.
Good to know
- It describes the market rather than giving signals. It's most useful as a filter for your own setups, for example only taking longs when the higher timeframes are up.
Questions
Can I change the EMA lengths?
It's too small on my monitor.
All 14 Holdout tools, one plan
Multi-Timeframe Panel plus every other indicator and both strategies for $39 / month or $349 / year, or $599 once.