Order Flow & CVD indicator
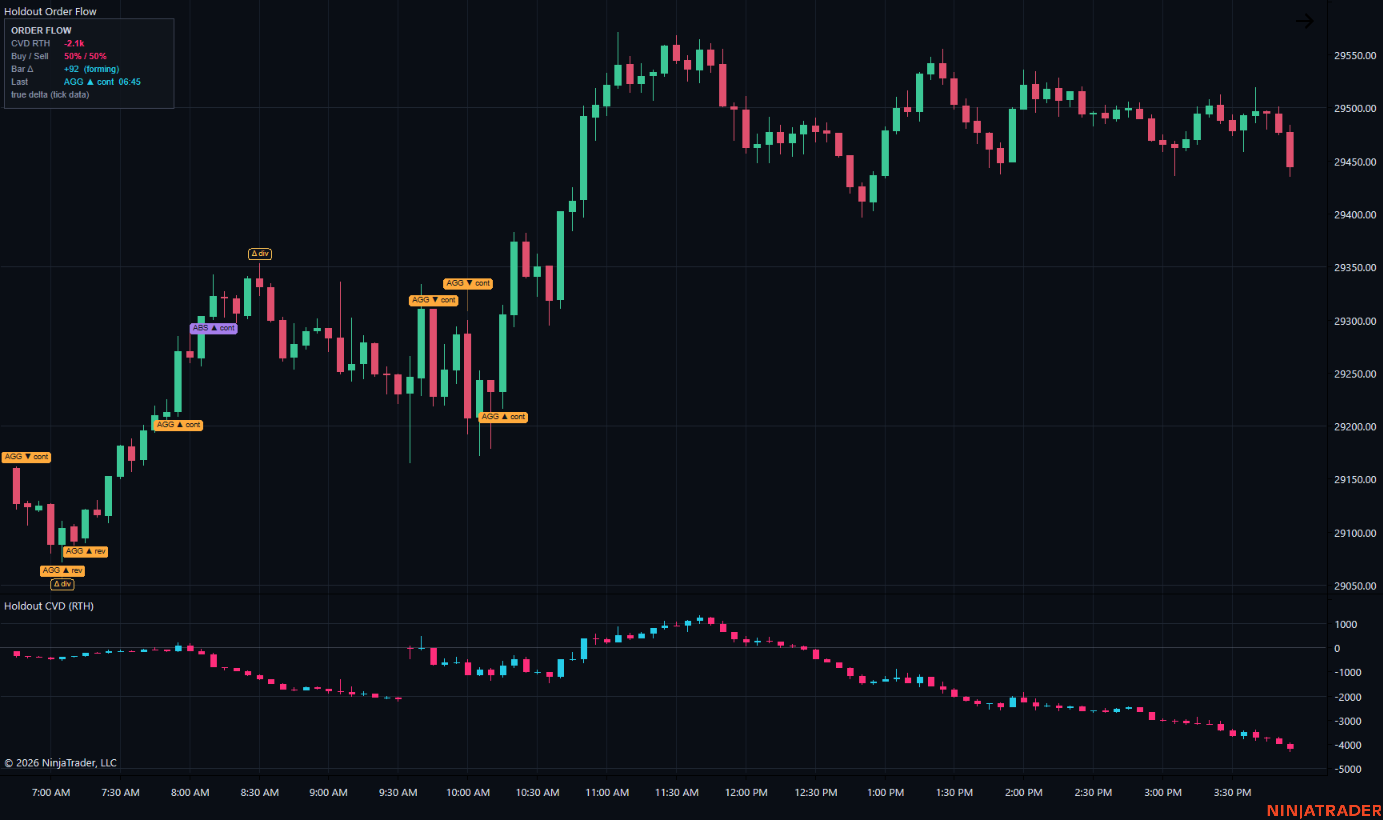
See who is pressing: the net buying minus selling volume (delta) in each candle, the bars where one side pushed unusually hard, and the running total since the open in its own panel.
Not sold separately: every Holdout indicator and both strategies come in one plan, $39 a month. See pricing or start with the free Session Levels Lite.
What it draws
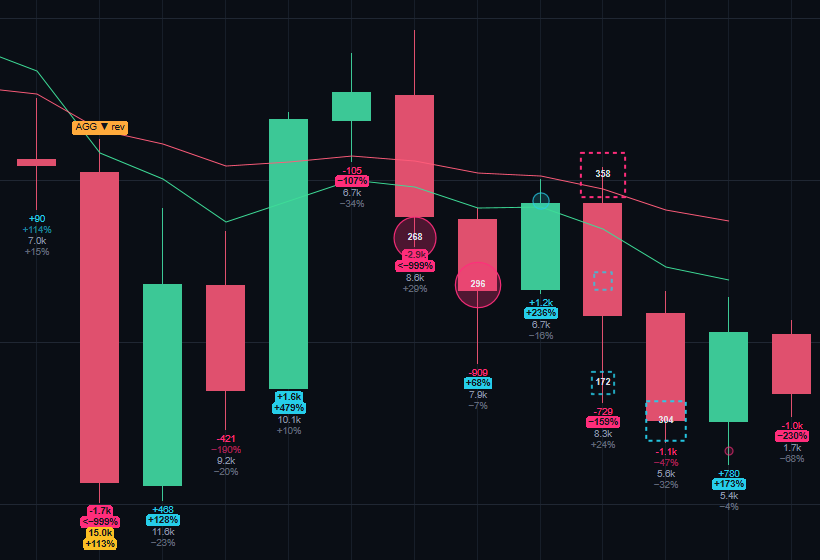
Delta and volume under every candle
Each candle's delta (buying minus selling volume) and volume, plus the change from the previous bar as a percentage. Unusual prints get a filled tag: delta or a delta swing twice the recent average, volume 1.5× average, or volume doubling into a heavy bar. Prints hide automatically when bars are too close to read.
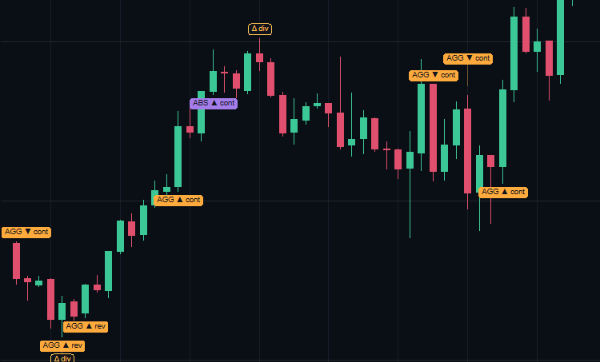
Aggression and absorption markers
AGG marks a bar where one side pushed unusually hard (big delta on heavy volume) and price moved with it. ABS marks big delta that price didn't follow: one side absorbed the other. Each is tagged ‘cont’ or ‘rev’, with or against the side of VWAP price is on.
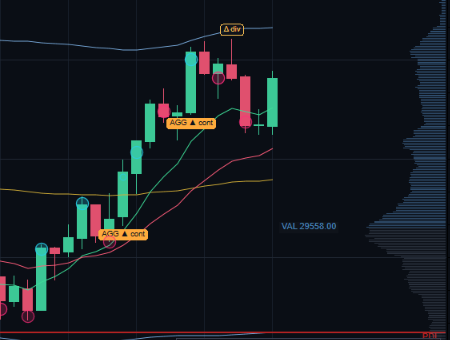
CVD divergence at swings
When price makes a new swing high or low but cumulative delta doesn't, the divergence is drawn at the swing.

The CVD panel
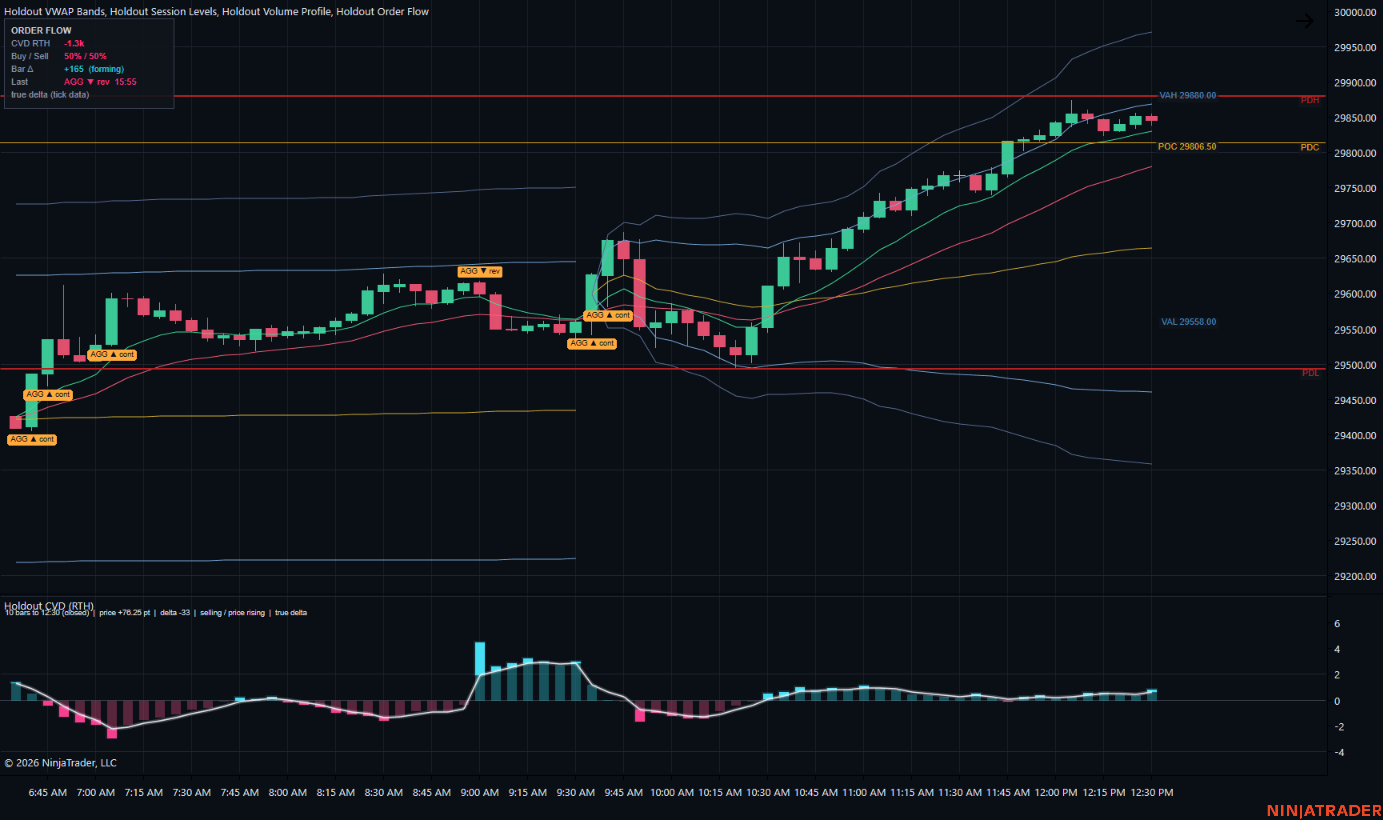
Holdout CVD shows cumulative delta in its own panel, as candles, a line, or a divergence view comparing the recent price move with the recent delta. It resets at 09:30, at the 18:00 session open, or never.
Reading the CVD divergence view
Each column compares the price move over the last 10 bars with the delta over the same bars. Above zero (teal), price moved further than the buying and selling explains: sellers were hitting the bid but price held or rose, so someone was absorbing them. Below zero (pink), delta outran price: buyers lifted the offer and price didn't follow. The white line is the smoothed reading; the bright, glowing tip of a column is the part reaching beyond that line, a gap that is growing faster than usual. The line at the top of the panel spells out the current window in words. Grey columns use estimated delta and aren't meaningful.
Summary box
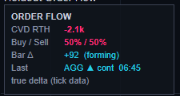
CVD since the open, the buy/sell split, the forming bar's delta and the last marker, in one small box.
True delta without Tick Replay
Recent history uses NinjaTrader's stored tick data, which records the bid and ask at each trade, so you get true delta without Order Flow+ or Tick Replay. Older bars use an estimate from 1-minute bars and are marked ≈.
Full feature list
- Delta and volume printed under each candle, with each one's change from the previous bar; prints hide automatically when bars get too close to read
- Unusual prints highlighted: delta, a delta swing or volume well above the recent average
- AGG markers: unusually large delta on heavy volume, with price moving in the same direction
- ABS markers: unusually large delta that price did not follow (one side absorbed the other)
- Each marker tagged ‘cont’ or ‘rev’: with or against the side of VWAP price is on
- CVD divergence at swing highs and lows (new price extreme, weaker CVD)
- A summary box: CVD since the open, buy/sell share, the forming bar's delta and the last marker
- Holdout CVD: cumulative delta in its own panel, as candles, a line, or a divergence view of price vs delta, resetting at 09:30, at the 18:00 session open, or never
- Optional candle coloring by delta
- Optional alerts on new AGG, ABS and divergence markers, in NinjaTrader and on your phone (Discord, Slack, Telegram or ntfy)
How it works
Each trade counts as buying when it executes at the ask or above and selling at the bid or below; trades inside the spread take the previous direction.
Recent history uses NinjaTrader's stored tick data, which includes the bid and ask at each trade, so you get true delta without Tick Replay. Three days by default, adjustable.
Older bars use an estimate from 1-minute bars: volume weighted by where each minute closed within its range. Markers on estimated bars are shown with ≈.
A marker needs delta at least twice its 20-bar average and volume at least 1.5 times average. AGG also needs price to move at least half an average bar's range with the delta; ABS needs price to barely move.
The CVD panel's divergence view compares the price move over the last 10 bars with the delta over the same bars, each scaled by its own recent average step. Columns above zero: price moved further than delta explains (sellers hit the bid but price held or rose). Below zero: delta outran price (buyers lifted the offer but price didn't follow). A white line smooths the columns, and the part of a column reaching beyond the line is lit up.
Good to know
- Built for reading who is in control as it happens. Pair the markers with your own levels and setups; Holdout's opening range breakout uses the same delta to confirm its breaks.
- True delta reaches back as far as your data feed keeps tick history; older bars use the 1-minute estimate, so the whole chart is always filled in.
Questions
Do I need NinjaTrader's Order Flow+ or Tick Replay?
Why is my CVD different from another platform's?
What do ‘cont’ and ‘rev’ mean?
How do I read the CVD divergence view?
All 14 Holdout tools, one plan
Order Flow & CVD plus every other indicator and both strategies for $39 / month or $349 / year, or $599 once.